Analysis of Video Game Sales
Introduction
In this project, we propose to build a model that can predict video games sales based on features from dataset. Emphasis is placed on video game publishers like play station which will help them predict which games will be best sellers before they are released. The data we used identifies games based on genre, publisher, platform, etc. giving us multiple factors useful for predicting a game’s success. The main work that we have done includes: analyzing the features of data set via datavisualization, processing the data set, using four regression model to predict the model. We selectes 4 different machine learning models as candidates including linear regression, ridge regression, random forest regression and KNN.
Requirements
You can find the code I used on my Github repoimport numpy as np
import matplotlib.pyplot as plt
import seaborn as sns
from datetime import datetime
from pandas import Series
import seaborn as sns
import numpy as np
from sklearn.metrics import precision_recall_fscore_support
from sklearn.linear_model import LinearRegression
from sklearn.ensemble import RandomForestRegressor
from sklearn.linear_model import Ridge
from sklearn.preprocessing import LabelEncoder
from sklearn.model_selection import train_test_split
from sklearn.ensemble import RandomForestClassifier
from sklearn.linear_model import LogisticRegression
from sklearn.metrics import classification_report, f1_score, accuracy_score, confusion_matrix
from sklearn import svm
from sklearn.metrics import roc_auc_score
from sklearn.metrics import roc_curve
from sklearn.metrics import auc
from sklearn.model_selection import learning_curve
from sklearn.neighbors import KNeighborsClassifier
Data Source
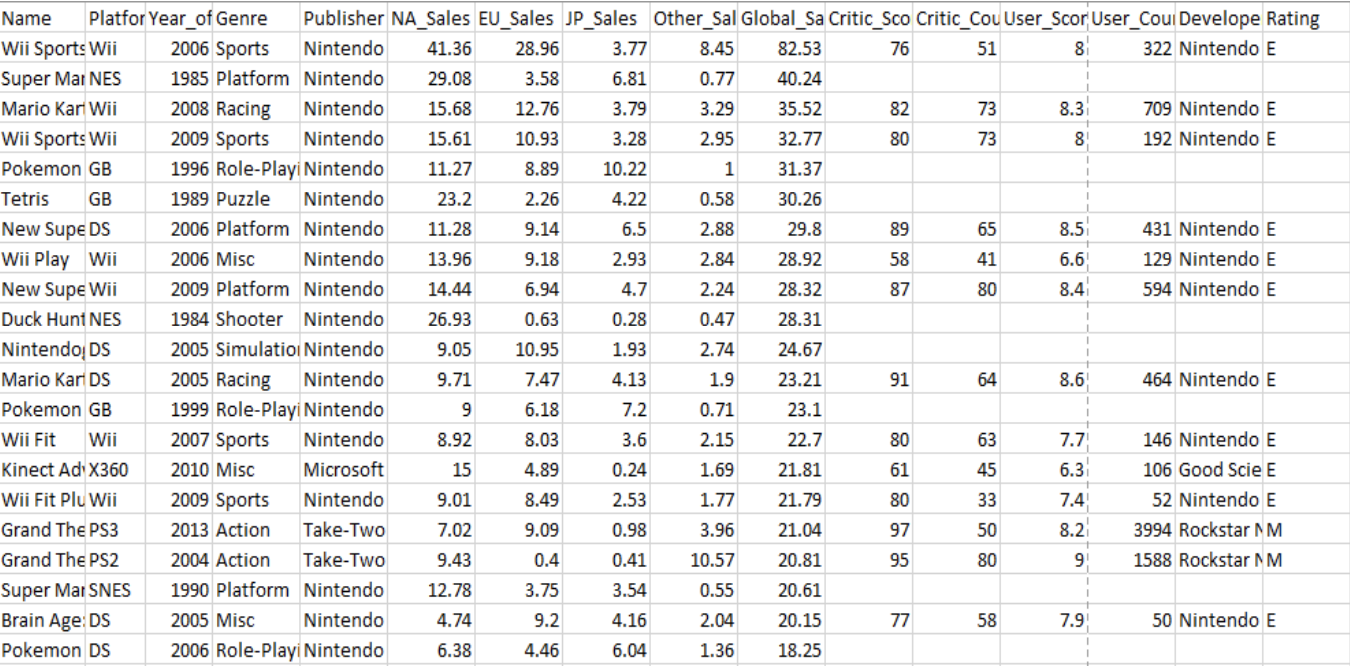
The original dataset has games ranging from 1980 to 2020 with 11,493 different game titles. There are 579 publishers with 31 platforms. Games are broken down into 12 unique categories as follows: Sports, Platform, Racing, Role-playing, Puzzle, Misc, Shooter, Simulation, Action, Fighting, Adventure,and Strategy. The dataset was taken off of Kaggle, but originates from VGChartz, a business intelligence and research firm. Additional data has been provided by Metacritic which has critics’ scores, user scores, developer name, and rating for recommended maturity of player. The shape of dataset is (16719, 16)
Glimpse of the data
Data Cleaning
Changing data type: From the overall review of our data set, we can see that the data are in different data type. Some of them are numerical data, like user score, user counts, critic score and critic counts. While some of them are text data, like Name of game, publisher and platform. We must change the data type for our further work.
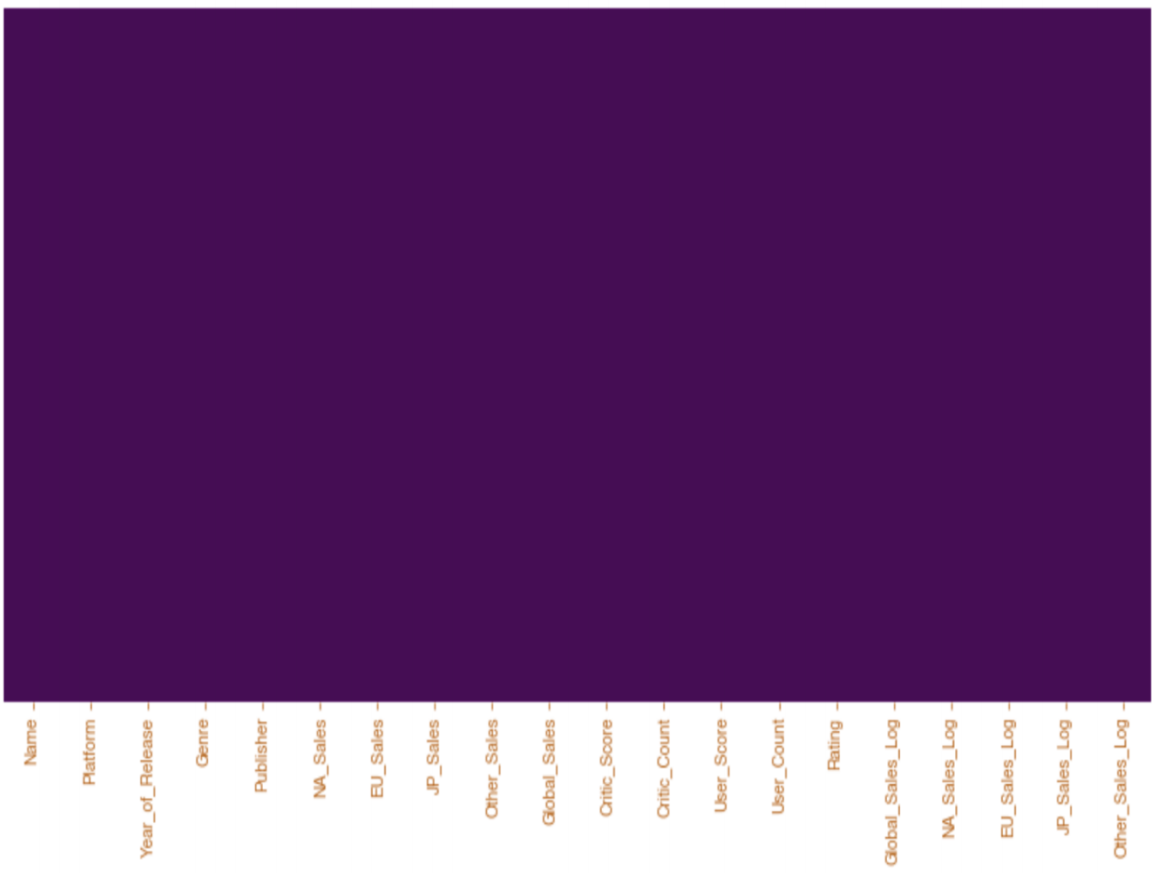
Processing missing data: We can see that lots of game do not have the feature critic score and user score, which will make a vital impact on our project. According to this poor data set, we must fill the missing values with some rational data. Below figure shows missing data in the corresponding data columns. 
- Textual data: If the original data type is text, we need to fill the missing data with appropriate value or general text “TBD/ Unknown”.
- Numerical data If the original data type is numerical, we need to fill the missing data with this column’s mean value.
- Outlier: Outlier is an observation that lies an abnormal distance from other values in a random sample from a population. there are outliers in sales columns. They might be useful for training as they indicate bestseller games, but for now we are going to remove them and maybe add them later
Data Analysis
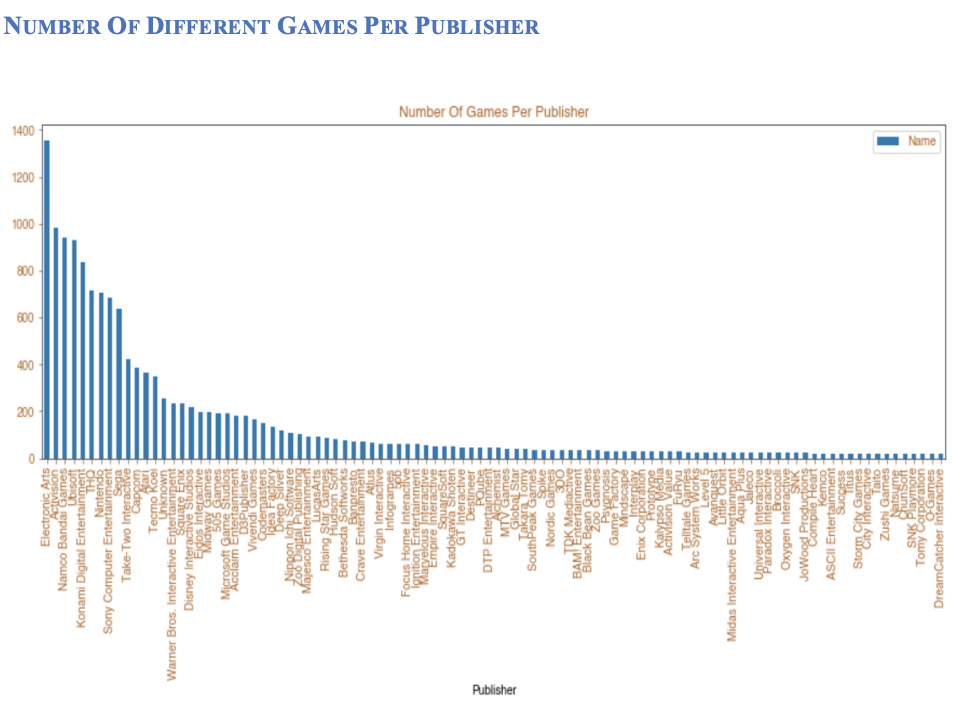
Below are few of the analytic questions which the dataset can answer 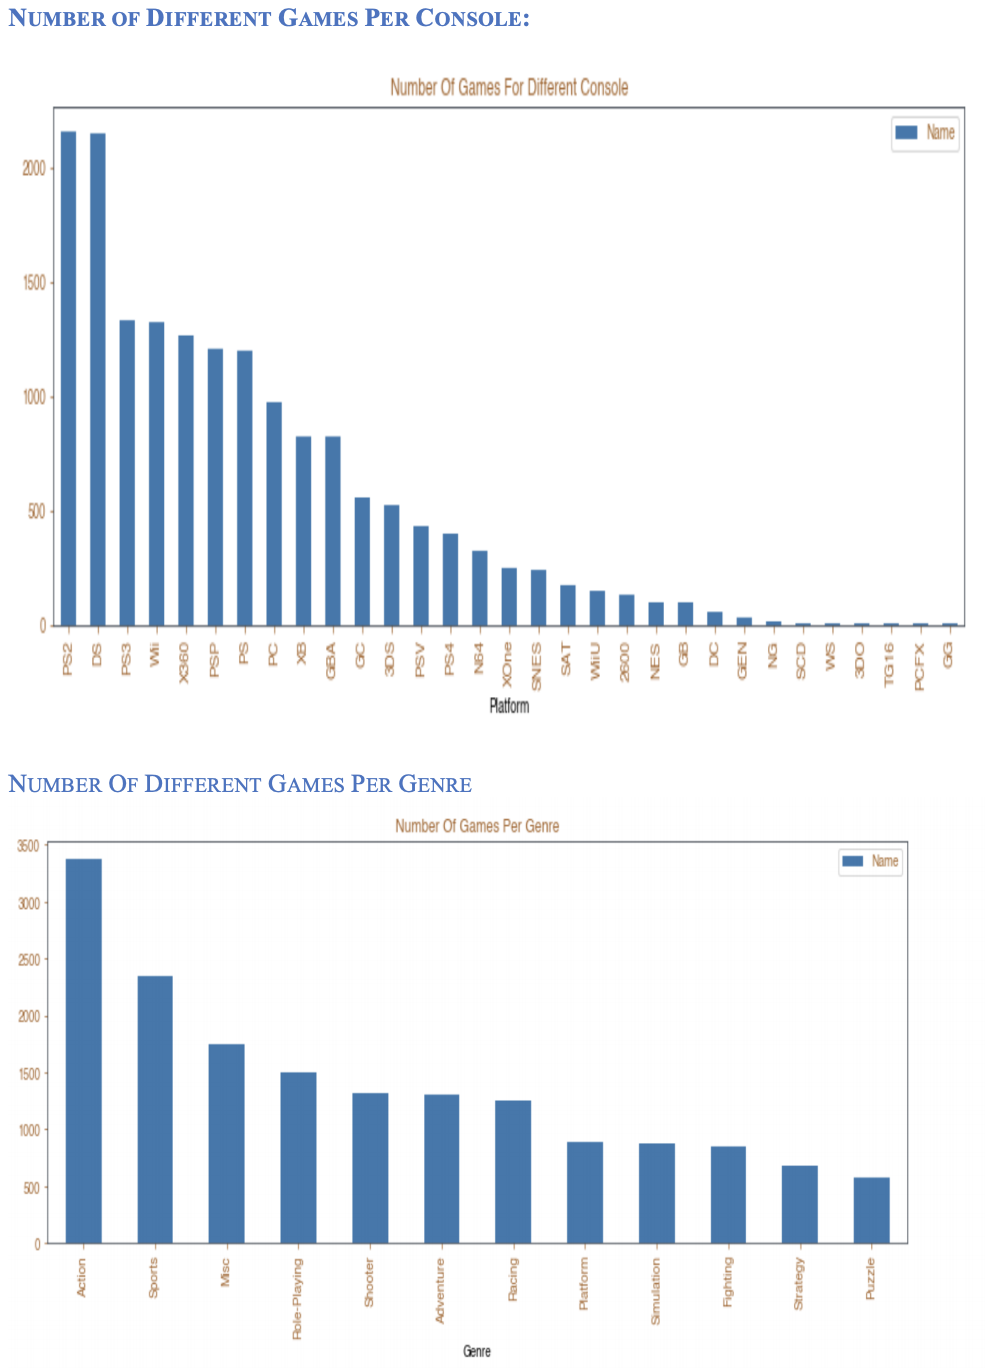
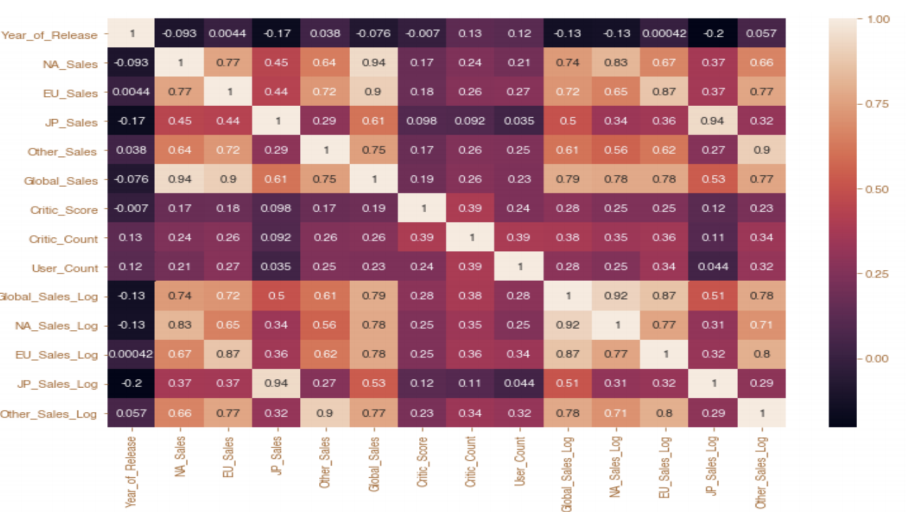
Data Correlation
ML Problems
1. How Global Sales Gets affected with Critic_Score_x', 'Critic_Count_x', 'User_Score_x', 'User_Count_x', 'year_after_release_x' X: Critic_Score_x', 'Critic_Count_x', 'User_Score_x', 'User_Count_x','year_after_release_x' Y: Global_Sales_Log
MODELING: We use 1/2 of all data in the data set as training data and the left 1/2 data as testing data. we will evaluate the model performance by Mean Absolute Error(MAE). At the meanwhile, we will make plot graph of each models for visualized assessment of their performance.
| Linear Regression | Ridge Regression | Random Forest Regression | |
|---|---|---|---|
| mean_absolute_error | 0.09902835743695935 | 0.09908128080265304 | 0.09884309984717227 |
| mean_squared_error | 0.02286022063308966 | 0.022863384030535606 | 0.02510867527810916 |
| accuracy | 0.8523184660252421 | 0.8522980298538295 | 0.8379337860864112 |
Scatter Plot Comparision for Linear Regression,Ridge Regression,Random Forest Regression

Second ML Problem:
Does a game hit gets affected by Year_of_Release Critic_Score X: Year_of_Release ,Critic_Score Y: Hit
Modeling: We use 1/2 of all data in the data set as training data and the left 1/2 data as testing data.
| Random Forest Classifier | Logistic Regression | |
|---|---|---|
| mean_absolute_error | 0.18015534953645704 | 0.16612377850162866 |
| mean_squared_error | 0.18015534953645704 | 0.16612377850162866 |
| accuracy | 0.8198446504635429 | 0.8338762214983714 |
| variance_score | 0.20697724448893373 | 0.014201230193749192 |
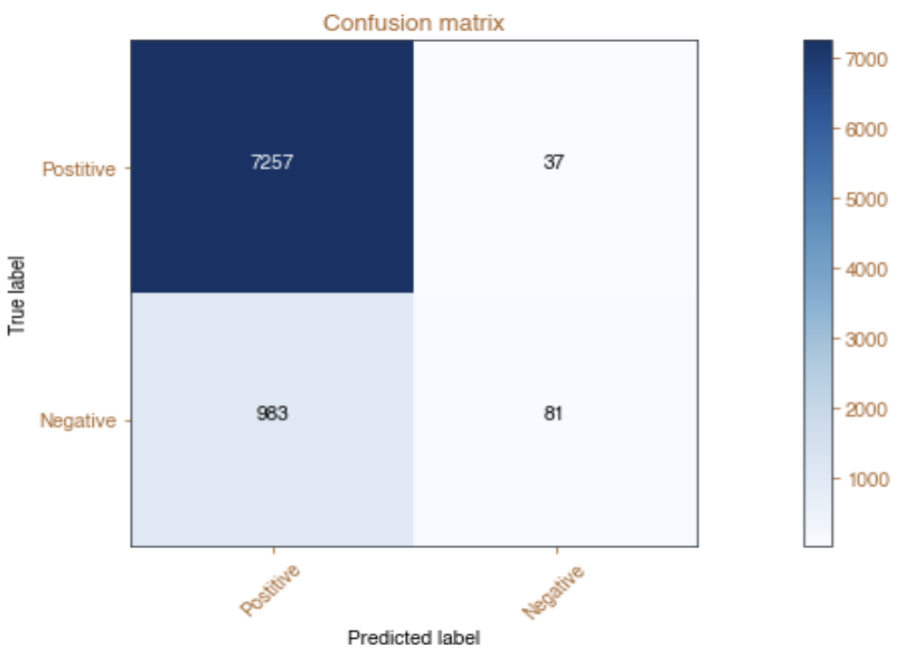
Confusion Matrix
Classification Report

Receiver Operating Characteristic curve
This type of graph is called a Receiver Operating Characteristic curve (or ROC curve.) It is a plot of the true positive rate against the false positive rate for the different possible cutpoints of a diagnostic test.Roc area curve for this example is 0.54 